
Technical analysis in stock market is done to forecast the price movements of Stocks, Indices, Commodities, Futures, options or any tradable financial instruments based on past price action.
It can be done by various tools, studies, technical indicators, charts etc. across different time frames such as Intraday, Daily, weekly, Monthly and even yearly.
This monster guide on technical analysis will help you as an trader and investor to be at better position than others while trading and investing in any instruments.
It is because technical analysis applies to any tradable instruments where the price is governed by the forces of supply and demand, moreover whether you are from U.S, U.K, Canada, India or any other part of the world the rules are same irrespective of the market.
Just like if you know how to play football, it does not matter at which stadium, ground or country you are playing in, the rules remains the same.
However this does not happens with fundamental analysis because fundamental analysis is very much different for equity class when you compare it with commodities.
However, before we proceed to understand about technical analysis in stock market in great detail, I would like to tell you upfront that it is not possible for you as an beginner to grab all at once.
What I mean is in order to understand various tools, indicators and implementing the same in live market takes time, so never hurry until you have the basic understanding of few of them.
Therefore read and understand every part gradually and do not forget to implement them in live market, as an caution you can apply these in live market with as little money as possible just to get the crux of the whole ecosystem of technical analysis.
Just to let you know the guide is long and informative as it requires to cover most basics as well as important factors, so it may take some time for you to understand them. Having said that, Learning technical analysis can be a daunting task as an beginner but if done properly you can reap the benefits for lifetime for sure.
Another point which I always mention is whether you are doing trading or investing please understand, it is about your hard earned money, never take it for granted hence try learning and exploring new things related to same every now and than.
Enough of philosophy lets come to back to main topic now, i.e. technical analysis and its importance and how one should approach. There are lot of question you might have as of now, but do not worry I have tried explaining at least most of them in a single post for you in simple terms so let us begin to dive deep in to the subject step by step.
What Is Technical Analysis In Stock Market?
In simple terms technical analysis in stock market refers to reading and understanding the historical statistics and data to conclude or forecast the future price movement of any financial instruments using different tools, indicators, pattern formation, charts etc.
Technical Analysis is a research technique to spot trading opportunities in the market based on action of market participants i.e. the buyers and sellers.
The actions of market participants can be seen using a chart or graph which is easily available on a trading platform provided to you by your stock broker.
In technical analysis one should not be concerned with the valuation of the stock i.e. the fundamentals of the company, but rather be concerned about past trading data only.
These data get represented in form of a stock chart, utilizing a stock chart over time, patterns are formed within these charts, and each pattern tells a certain message. The job of you being a technical analyst is to identify these patterns and develop a point of view which can be implemented while trading.
Like any other research technique, technical analysis is also based on certain bunch of assumptions. Let us know them in detail.
If you are looking for the best stockbroker I would recommend you to checkout this broker, or you can directly use the below link to open the account free of cost.
Base Of Technical Analysis In Stock Market:
The base idea of technical analysis is:
1.History Repeats Itself:
One of the base of technical analysis is ‘History tends to repeat itself’ this simply means that the patterns formed earlier on charts will going to repeat itself in the near future as well irrespective of whether it is undervalued or overvalued.
This is not only true in sense of stock markets but for any other field as well, one can say ‘fashion repeat itself’. This happens primarily because of the natural human tendency to react on any given situation.
For example, if the price of the stock is moving up for sometime than market participants will buy it any level similarly, If it is going down one will sell irrespective of low and unattractive prices.
So while doing technical analysis finds a pattern in the stock’s data, assuming that the pattern will repeat itself in the near future and places trades in the way that the pattern directs.
2.Market Discount Everything:
The second theory suggests that every known or unknown component that may perhaps affect both demand and supply is already considered in the market price. The next observation is that the market reflects all available information.
Even the information which are not in public domain. Everything there is to know is already reflected in the markets through the price. However natural calamities like drought, cyclone, flood or earthquake can’t be factored.
All major geopolitical events, trade war, domestic policies, elections, GDP growth, changes in interest rates, earning projections or expectations are already priced in the market.
The unexpected events will definitely occur, but it usually affect the short-term trend. The primary trend will remain unaffected.
3. Price Moves In Trend:
You might have heard of a phase ‘Trend is your friend’ or ‘Trade with the trend’, this simply means that market overall as well as a particular stock moves in a trend and not random. That is the price moves from short to medium to long term following a particular trend.
For example the move of Nifty50 Index last year in 2020 from 9000 to 14ooo level despite the pandemic (Coronavirus) shows that primary trend always remains intact what may be the short or medium term forecast shows.
But what is a trend exactly? Let us know a little about the same
What Is a Trend?
In layman terms a trend is the direction in which the price of an asset is heading, at any given point it can be either up, down or sideways. A trend is applicable to all time frames starting from short term (hourly, intraday, daily,), medium term (weekly, monthly) long term (yearly).
Uptrend: Uptrend is defines as series of higher highs and higher lows. During an uptrend a stock moves in the upward direction making new highs. As seen in below image H4,H3,H2, are known as swing highs where as L4,L3,L2, are known as swing lows.

Downtrend: A series of lower highs and lower lows is known as downtrend. During downtrends a stock makes lower top and lower bottoms, telling the direction of the stock moving down.

Sideways or Flat Trends: When a stock moves neither up or down instead goes on moving in a range for longer period of time than it is termed as sideways trend. It can be a consolidation phase for a stock or market overall.

As an trader and investor one should always look at the prevailing trend in the market or stock to better understand what to expect in future.
Depending upon your trading strategy you should look for trend for example as an intraday trader look for short term trend whereas for investing look for long or mid term trends.
If one is able to identify the trend as early as possible success of riding the trend will reap benefits without doubt. Having said that to know and identify the trend you should be aware of different types of trend in share market.
The Stock Market Has Three Trends:

a)THE PRIMARY TREND:
It can be as long as one year to several years and is the ‘main movement’ of the market. These movements are typically referred to as bull and bear markets.
This primary uptrend is called as bullish on the other hand primary downtrend can be considered as bearish trends.
The reality of the situation is that nobody knows where and when the primary uptrend or downtrend will end.
As you can see in the image above when a stock is moving in primary uptrend it makes new high followed by few lows not lower than the previous lows.
Similarly the same patterns follows when it is in primary downtrend. We will learn below how to at least identify the trend, so that one can ride the profits with the ongoing trend.
The objective of technical analysis in stock market is to utilize what we do know, not to make chaotic guess about what we don’t know.
b)THE INTERMEDIATE TREND OR SECONDARY TREND:
This trend can last between 3 weeks to several months. Secondary movements are reactionary in nature, think of them as corrections during bull market, or rallies & recoveries in the bear market.
In a bull market, a secondary trend is considered a correction. In a bear market, secondary trend are called reaction rallies.
So suppose if a stock during its primary uptrend made a high, it will retrace back to some points to make a low (known as intermediate trend or correction).
Likewise during an primary downtrend, a stock can make a high after falling for several months or years (known as bear market rallies).
c)THE MINOR TREND OR DAILY FLUCTUATIONS:
This trend is least reliable which can be lasting from several days to few hours. If you are a intraday trader you should pay attention to this otherwise for investors I would suggests not to put much attention to these trends. As a Long-term investor it is just the part of corrections in secondary uptrend or downtrend rally.
This are just daily fluctuations happening in market on day to day basis. It constitutes of noise in market and perhaps be subject to manipulation.
Out of the three trends mentioned only primary and secondary trends are trustworthy. However, the study of daily price action can add valuable insight, if you look in context of the larger picture.
So when you are looking for daily price action of several days, or weeks try to evaluate bigger structure getting formed. By putting enough attention one can certainly benefit in short term rallies.
A few pieces of a structure are meaningless, yet at the same time, they are essential to complete the entire picture.
If you are looking for the best stockbroker I would recommend you to checkout this broker, or you can directly use the below link to open the account free of cost.
4. Dow Theory:
The fourth base of technical analysis is dow theory which is one of the most trusted theory in history of financial market. Whether you are intraday trader, short-term trader or a long term investor knowing this will certainly help you in building different strategies.
There are 9 tenets that are behind the Dow Theory out of them 2 we have already covered above, Market discount everything and prices moves in trend and its types.
Now, pay attention as these trends that we have understood have different phases, These are Accumulation phase, Public participation phase and Distribution phase.
These phases are cyclic in nature and repeats over the time.

a)Accumulation phase:
This phase occurs when the market is in bearish trend, sentiments are negative with no hope for any upcoming uptrend. For example as we saw in Indian share market a steep low in mid cap stocks, making new lows every other day.
Most of the investors see them stay in this trend for unknown time period. However, this is the time when big investors, huge fund houses, institutional investors start accumulating them gradually.
Stocks are cheap, but nobody seems to want them but the so called ‘smart money’ find this period attractive enough to invest.
This is known as smart money keeping their view for long term investment. Although you would see sellers in market still selling these stocks, they find the buyers easily.
One thing is very important to keep in mind, this is level when stocks will create their major support level. You might have heard many analyst saying on television screen that this particular stock or market has bottomed.
This is the first stage of a bull market, stocks begin to find a bottom and quietly firm up.
b)Public participation phase:
At this phase the market have already absorbed the negativity with ‘smart money’ getting invested. This is the second stage of a primary bull market and is usually sees the largest advance in prices.
During this phase majority of public (retailers) also thinks to join in as the price is rapidly advancing. However most of them are left behind due to speed in rallies as well as the averages start heading higher.
If you are also a trader or investor you might have this experience and a regret of not able to participate with rally. It is a period followed by improved business conditions and increased valuations in stocks.
Earnings of company starts to rise again and confidence starts to get build. You can consider this as the easiest stage to make money as participation is wide and the trend followers begin to participate.
c)Distribution phase:
The third stage is the excess phase which eventually be turned to distribution phase. During the third and final stage, the public (retailers) gets fully involved in the market, as they get mesmerized by the bull market rally.
Some of them who felt left will still try to look for valuations and want to be part of the rally.
But this is the time when ‘smart money’ starts liquidating shares on every high. Whereas public will try to buy at this level absorbing all liquidating (sell-off) volumes made by big investors.
As a matter of fact the normal investors will look it as an opportunity to make an entry as it seem the stock is trying to find a support level.
On contrary in the distribution phase, whenever the prices attempt to go higher, the smart money off loads their holdings.
Over a period of time this action repeats several times and thus forms the resistance level. Once all the shares are off-loaded, the price does not find support. This leads to steep fall in prices of shares, which eventually is the beginning of bear market.
This is how the bull market start from beginning till end.
Just as accumulation is the benchmark of the first stage of a primary bull market, distribution marks the beginning of a bear market. As the “smart money” begins to realize that business conditions are not quite as good as once thought, they start to sell stocks.
The public is still involved in the market at this stage and become willing buyers.
All this phases takes few months to years to complete. Another key point is after the completion of distribution phase, market moves in opposite direction.
This is the beginning of bear market, where sentiments will start turning negative, you will see more and more companies filing bankruptcy, change in economic growth etc.
During bear market the level of frustration rises among retail investors as they start loosing all hopes.![]()
The Averages Must Confirm Each Other:


Dow used to say that unless both Industrial and Rail (transportation) Averages exceed a previous peak, there is no confirmation or continuation of a bull market.
Both the averages did not have to move simultaneously, but the quicker one followed another – the stronger the confirmation.
To put it differently, observe the image above, as you can see both the averages are in bull market, trending upward from Point A to C.
The industrial average is intact and rising towards new peak, however there is slight down movement seen in transportation, due to which it failed to make a high above the point A.
Transportation average fall to point D which created a new low in the market, confirming the weakness in the sector. This may result in trend is getting changed towards bear from bull and further decline can lead to downfall in industrial averages as well.
To talk about this theory of average must confirm each other in Indian stock market prospect, you can not call the market bullish overall, if there is bullishness in only Nifty auto or Nifty Bank indices. If market is bullish than all other indices must follow the same trend.
Volume Must Confirm the Trend:
Volume is a tool to know how many shares have been bought and sold in a given period of time. It helps in analyzing the trends and patterns.
Whether you are talking about shares of an individual stock or the number of options contracts traded, or an entire stock market, volume information can be found just about anywhere.
Now according to dow theory, a stock must be in uptrend with high volume and low in corrections. On the other hand volume must rise during price fall in a stock and low volume should appear when stock rises during downtrend.
Volumes may not be an attractive piece of information but you should try to combine the volume data with resistance and support levels to get a clear picture. You can read more about volume here.
If you are looking for the best stockbroker I would recommend you to checkout this broker, or you can directly use the below link to open the account free of cost.
Trend Is expected to Be Continued Until Definite Signals of Its Reversal:
Quite similar to Newton’s first law of motion which states that an object will remain at rest or in uniform motion in a straight line unless acted upon by an external force.
In simple words an object will remain in their state of motion unless a external force acts to change the motion.
Likewise, the market will continue to move in a primary direction until a force, such as a change in business conditions, is strong enough to change the direction of this primary move. You can also see the signals for reversals when a trend is about to change.
I hope you have understood these important theories which makes technical analysis base for stock market overall. You can read Dow theory and different dow patterns here.
Now, before we proceed further to understand more about technical analysis in stock market, let me clear few concepts related to fundamental analysis.
Difference Between Fundamental and Technical Analysis?
Fundamental analysis is the method of evaluating a asset by analyzing balance sheet, income statement, profit/loss, cash flows, and other financial/non financial data about the company. So, if you want to know which security to trade or invest use fundamental analysis.
Whereas on the other hand technical analysis use charts, patterns, technical indicators such as Moving Averages, MACD, Bollinger band, Support/Resistance levels, RSI, Volume etc. to help in making trading decisions. Technical analysts look for trends in the market.
So, if you want to know when to trade i.e. entry, exit points or Price at which one should buy and sell stocks use technical analysis. TA, is best used to identify short term trades and do not use TA for identifying long term investment opportunities. Long term investment opportunities are best identified using fundamental analysis.
Often market participants approach technical analysis as a quick and easy way to make a huge gain in the markets. On the contrary, technical analysis is anything but quick and easy.
Yes, if done right, a huge gain is possible but to get to that stage, one must put in the required effort to learn the technique.
TA based trades are usually short term in nature. Do not expect huge returns within a short duration of time. The trick with TA being successful is to identify frequent short-term trading opportunities that can give you small but consistent profits.
If you approach TA as a quick and easy way to make money in markets, trading catastrophe is bound to happen. Hence before you start delving deeper into technical analysis, it is important to set expectations on what can and cannot be achieved with technical analysis.
Trades based on technical analysis can last anywhere between few minutes and few weeks, and usually not beyond that.
Now, that you have basic understanding of difference between technical and fundamental analysis, let us focus back step by step towards understanding technical analysis and what next you need to know.
After understanding base of technical analysis it’s time to introduce charts and candlestick patterns and how to read and use them.
Charts, Candlestick Patterns Use In Technical Analysis:
Charts are graphical representation of all the data in a single line, bar or candles, that gives enough information to make future predictions possible. One can visualize the ongoing trend of a particular stock or any index, helping to build new positions in market.
There are majorly five types of charts:
- Line chart
- Bar charts
- candlestick charts
- Renko charts
- Point & figure charts
There are other few more chart types, but out of these candlestick charts are the one used by majority of traders in trading community.
Below image shows how line chart looks. Line chart uses only one data point i.e. closing price of the stock, you can see the overall trend but, it will not help you in knowing additional information and that is why it is used rarely.

Bar charts are little more advanced as it uses four data points OHLC (open, high, low, close) of a stock. However, bar charts lack the visual appearance as it does become tough if you are using multiple chart trying to analyze the market. Look at the below bar chart, color of bars can vary depending upon the platform you are using for charting.

Bars charts does not create any patterns that one can use strategically for trading or investing. We will not waste our time to understand something, which we will not going to use.
Same with the case of renko and P&F charts. Hence its better to focus and give time to understand candlestick charts and its patterns & how to take benefit of them during trading and investing in stock market.
Candlesticks tend to form patterns which are interpreted by traders and investors, to identify a continuation or reversal of the existing trend in a stock or indices (e.g. Nifty, BankNifty).
Yes, there are other forms of chart like, line chart, bar chart, renko chart, p&f chart, but Japanese candlestick charts stand at first in the queue. Reason being, it’s not only trustworthy, but it gives you lot of information related to price movement.
The kind of patterns it develops, will provide you enough information to make future predictions regarding you trades.
Also, the kind of attention Japanese candlestick charts have received, there is no comparison to other chart types. It is easy to understand & interpret at the same time, with great accuracy.
How To Read Candlestick Charts For Technical Analysis?

Candles can be categorized as a bullish (green) or bearish(red) candle usually. The colors can be customized to any color of your choice depending upon the technical analysis software you use.
To read candlesticks one has to pay a closer attention to the overall body of the candle.
Above image tells us the same. There are three parts in a single candle, let us try to understand bullish(green) candle first.

- The main body or real body, rectangular in shape it connects the opening and closing price
- Upper shadow link the high point to the close
- Lower Shadow joins the low point to the open
Let us see now the bearish(red)candle:

- The main body or real body, rectangular in shape it connects the opening and closing price. However, bearish candles is opposite to bullish candles, the opening is at the top end and the closing is at the bottom end of the rectangle.
- Upper shadow link the high point to the open
- Lower Shadow joins the low point to the close
I don’t think, I need to explain what is open, high, low, close? they are self explanatory if you see the candle. However for reference this what OHLC means:
Open – When the markets open for trading, the first price at which a trade gets execute is called the opening price.
High – This tells us the highest price at which the market participants (traders or investor) are willing to transact for the given day.
Low – This shows the lowest level at which the market participants (traders or investor) are OK to transact for the given day.
Close – Closing price is the most important price, as it is the final price at which the market closed for a particular period of time.
Closing price also useful as an indicator for the intraday strength. If the close is higher than the open, then it is considered a positive day(bullish) otherwise negative(bearish).
If you have the OHLC data with you, now you can easily plot both the candlesticks (bullish and bearish). However, you do not need to do this manually, the software does it for you.
You just need to take a look at the various points to understand its opening, closing, high, low value.
What Is Range of the candle?
The length of the candle (upper shadow to lower shadow) denotes the range, it moves depending upon the time frames you have chosen (1min, 5min, 30min, day, week, month etc.) for candlestick charts. It gets calculated by subtracting the high from the low of the candlestick.
Range = High – Low
Range also indicates the volatility, higher the range more is the volatility and vice versa. Another key point is of short candles, it can be considered that the trading action was gloomy for the day without much movement.
You can consider the shadows as tests of a price range. whereas, Candles with no shadow indicate a strong trend in one direction.
So, just to sum up these are things you need to look seeing a candlestick:
Price:
Opening price / Closing price/ stock price went up or down
Shadows/wicks:
The lower shadow shows Lowest level for the time frame / The upper shadow shows highest level for the time frame
Bearish(red) candle:
A red candlestick shows the open price at the top of the body / A red candlestick shows closing price at the bottom of the body.
Bullish (green) candle:
A green candlestick shows the open price at the bottom of the body / A green candlestick shows the closing price at the top of the body
Below charts depicts, how does a candlestick chart look like when combine with data point on a software analysis tool.

If you are looking for the best stockbroker I would recommend you to checkout this broker, or you can directly use the below link to open the account free of cost.
Best Candlestick Patterns For Technical Analysis:
You can classify the candlestick patterns in to two major categories:
- Single candlestick pattern
- Multiple candlestick patterns
A single candlestick pattern is formed by just one candle. Under single candlestick pattern there are many other patterns, but will study the most important one, they are:
- Marubozu
- Bullish Marubozu
- Bearish Marubozu
- Paper umbrella
- Hammer
- Hanging man
- Spinning Tops
- Doji
- Shooting star
- Inverted Hammer
While under multiple candlestick patterns are formed by two or more candles. Some of the best candlestick patterns are:
- Engulfing Pattern (a)Bullish Engulfing Pattern (b)Bearish Engulfing Pattern
- Piercing Pattern
- Dark Cloud Cover
- Harami Pattern (a) Bullish Harami (b) Bearish Harami
- Morning Star
- Evening Star
- Three White Soldiers
- Three Black Crows
You need to be aware of long/short candles, a similar pattern can exist with small bullish(green) or bearish(red) .
The only difference is, the short candle reflects lesser activity(buying or selling), on the other hand longer candle reflects high buying and selling.
Avoid taking any positions when you see the range or length of the candle is small. Below image tells you the same.

Candlestick patterns has more information packed into it than the conventional bar or line chart. That is why Japanese candlesticks charts have been used far more than any other charts put together.
Now, that you know the basics of how to read a candlestick you should learn different pattern formations and how to use them while trading or investing in stock market. Learn Best candlestick patterns and how to use them here.
Now, that you understood about the different types of charts and candlestick patterns its time to know one of the most important aspect of technical analysis i.e. Support and resistance (S&R).
How Support & Resistance Helps In Technical Analysis of Stock market?
Whether you are intraday trader, short/long term investor, you like trading options & futures or even if you trade in currency or commodities, without knowing about support and resistance you can’t trade or invest at all.
Support and resistance is the foremost technical analysis, which helps you to tell the direction or movement of any securities. If you want to do better and more accurate technical analysis of your trade, support and resistance levels is an essential ingredient to it.
As technical analysis is based on this perspective i.e. “History tends to repeat itself”. Hence, most of the tools or indicators gather the previous data and make you aware about the future price movements.
What is Support In Technical Analysis?
In a very simple terms support means to hold up something, so that it does not fall further. In the world of trading and investing support is a tool to find a point or a level on a chart that prevents the price of a stock/index from falling further. Surprisingly, you will find most of the buying activities here.
Support is the level at which the demand is powerful enough to stop the stock/index from falling any further. Whenever the price falls to the support point, it is expected to bounce back.
The rationale behind any stocks to bounce back is the demand due to falling of share price. It’s a very common logic people often use, even buying normal things in life.
If you can get 10% discount, instead of full price, people feel its worth buying, thinking maybe I won’t get this at those prices in future.
However it may happen the thing you have bought may be available at much discount tomorrow.
One thing to keep in mind, you will find support level always below the current market price. So whether you are trading stocks, or any index, you will find the support level below its current price.
Let me show you how stocks behave when the touch support level.

Above chart is of SBI, I have taken a long term view so using 1 year chart, for short trend one can use 3-6 month and for intraday use hourly or day chart. From left I have drawn an circle to mark the price, its in range of Rs.244 to Rs247.
The second circle range is Rs. 246 to Rs.251 and the third is the most recent hit happened due to worldwide pandemic coronavirus, the stock hit a sharp low.
However can you imagine, it still followed the support points and have bounced back from Rs. 181 to Rs.240. See, the levels can only be made in a range in long term view and even on intraday charts too you have to keep a range of at-least 2 rupees from current support.
The support level created within a period of one year was so strong that even in a pandemic situation, SBI stock tried to bounce back and touch those levels. We will discuss how you can use S&R while trading or investing in stock market further, but let us first quickly understand the resistance.
What Is Resistance In Technical Analysis?
I was a PCM student, have studied resistance in physics when I was in school. But that was related to the flow of current in a series & measured in units of ohm. When I was first came to know about the resistance in trading and investing, I got more interested.
See, resistance is just opposite of support. As the word itself says to resist or stop something. Resistance level on a chart depicts a level where the rising price of a stock/index will be halted.
The reason for any stock to move downward from it resistance level is due to heavy sell-off at rising price.
When stock rises people who have bought it lower will sell, and the demand of buying gets reduced due to high price. The resistance level is always above the current market price.
So, now you know the basic of resistance, let us look this in chart and see if this hold true or not and this time I am using a intraday 30 minutes chart of 1 month duration to check.

This AXISBANK chart is very exciting to watch, it’s just 1 month chart, as you can see the first support got created nearby Rs.401, it started rallying, than after 2 weeks it again touches the same support level and rallied again, however on 5, may,2020, the candle open in morning 9:15 touching the intraday resistance of rs.418, but not able to sustain, due to heavy sell-off , it broke the support level and now trading below the levels of Rs.400.
This is how resistance and support works together to give you signals when to enter or exit your trade.
Now, let us know a little about pivot points.
What is pivot point In Technical Analysis?
A pivot point is a technical analysis tool, or indicator you will be using while knowing the levels of S&R on chart. Pivot point is a calculations, which guide you to know the overall trend of the market over different time zones.
Pivot points gets calculated by averaging high, low and closing prices from the previous trading day.
If a stock/index is trading above the pivot point, the overall sentiments remains bullish (buy), on the other hand if it trading below PP this indicates bearish (short) sentiment.
You do not need to calculate it manually, there is no need. The pivot point indicator can be added to a chart, and the levels will automatically be calculated and shown on chart. Just need to search the indicator, pivot points and apply.
Pivot point is one of the greatest technical indicator you can use to plan out your intraday trades in any segment (equity, FnO, commodity etc.).
Below image tells you how pivot point looks on chart when applied:

Whether you a are a beginner or have little knowledge, without using this tool, you cannot trade with perfection. This is a must know tool that you will be using on every trades.
Once you find or identify support or resistance zone, those price levels can serve as potential entry or exit points because for your trade. Because when price reaches a point of support or resistance, it will do one of two things:
- Bounce back away from the support or resistance level
- Violate the price level and continue in its direction—until it hits the next support or resistance level.
You can read the complete guide on how to use support and resistance for intraday trading here. Now, let us discuss the next important factor to consider while doing the technical analysis in stock market, i.e. Volumes.
If you are looking for the best stockbroker I would recommend you to checkout this broker, or you can directly use the below link to open the account free of cost.
Importance Of Volume In Technical Analysis:
The term “volume” in trading indicate to the total number of shares that are traded in during a given period of time. That time can be of any frame(30min,1 hour, day ,month, year).
The volume of trade is calculated on all types of financial instruments, including stocks, options contracts, bonds, futures contracts, commodities, etc.
Every transaction that takes place between a buyer and a seller of a security contributes to the total volume count of that security.
In trading terminology, volume is a kind of technical analysis used to know current or future trends and patterns for an individual stocks, options contracts, futures, index like nifty, bank-nifty or the entire stock market.
Volumes help you to find, how many shares have been bought and sold in a given period of time in reference to an individual stock, a consolidated group of stocks, or with the entire market under consideration.
While trading or investing in stock market, you might have not paid that much attention to it, however knowing this wonderful tool can certainly help you to place better trades at correct timing.
You should look at volumes in case you want to find about the present perception of stock market participants(traders or investors).
Volume data for any security is easily available on your trading platform provided to you by your broker. Here how volume looks like on a trading software marked in yellow color:

As, you can see above there are various stocks listed, with different traded volume for the day. Before we dig deeper about the volume and its implication in stock market, let us know how it gets calculated.
Stock market or for that matter any market works based on demand and supply, this demand and supply is created by buyers and sellers in the market.
Likewise, in stock market for all buyers, there has to be the sellers, so that the trade gets completed by changing quantity of shares bought and sold.
As an illustration suppose if you buy 100 shares of google at some price, and your friend sell 100 shares of google at the same price.
You and your friend together have created a volume of 100 shares in total. Many traders not only newbie, makes an assumption that volumes count for above will be 200 (100 buy+100 sell), which is wrong.
It’s critical to note that when counting volume, each buy/sell transaction is counted only once.

Check image above, orange box tells about the market timings, buy & sell quantity with cumulative(growing) volume its creating at every passing time during live market.
In total the volume that got created at the end of the trading session for the day is 3400, basically for every buy/sell quantity its get added only once(300+300=300).
This happens in live market at every microsecond, because of this fight between buyers and sellers for the best price creates short-term price movement.
Let us take an example by plotting a volume bar indicator on a chart, to see exactly how it looks like:
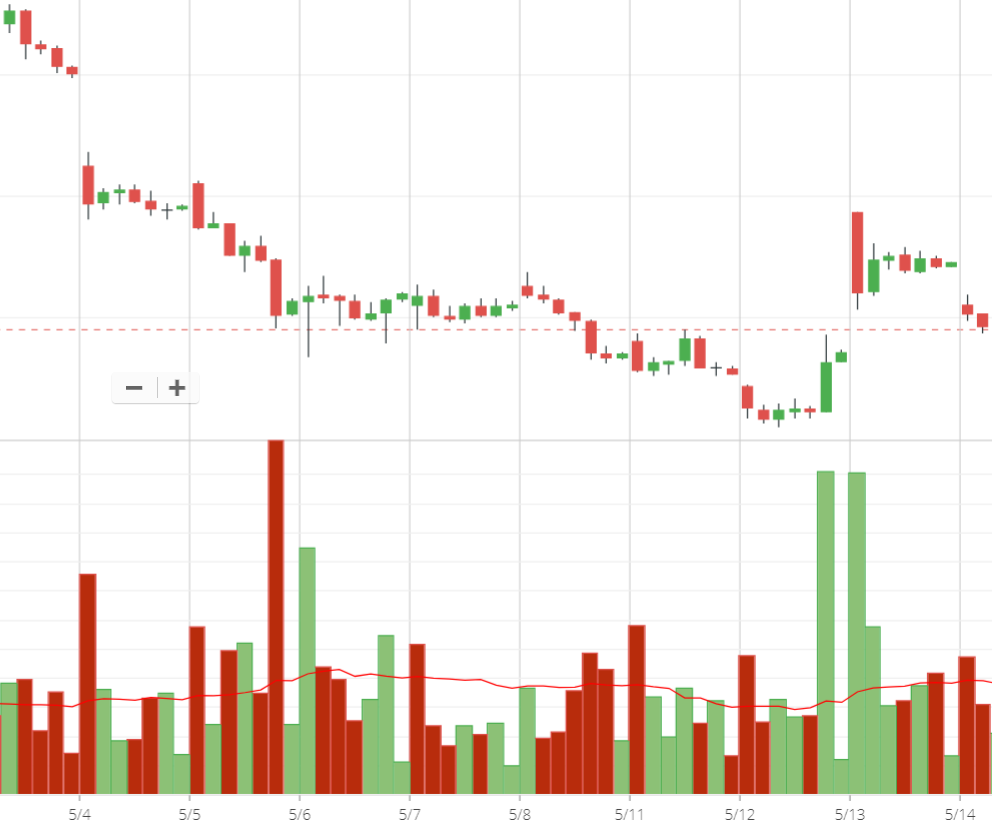
Above is SBI BANK (1hour) chart, below the candles you can see the volume bars, I have also plotted a moving average (26 day SMA) to know if today’s volume is higher than the previous days volume average. W e will understand about moving averages later in this post.
As, you can see the volume bars going crazy during certain time period, Let us know the steps to read what this volume bars are telling.
If you are looking for the best stockbroker I would recommend you to checkout this broker, or you can directly use the below link to open the account free of cost.
How To Read Volume For Technical Analysis?
Volume information in isolation has no value, suppose you checked and got to know the volume in TATA Motors stock is 4,23,58,626.
What you will be going to do with this? However when you relate today’s volume information with the previous price and volume trend, then volume information becomes much more meaningful.
To read and interpret the volume correct way, one has to know the volume trend table listed below, take a look.

Above table clearly shows and inform you when to make an entry or exit while placing an order. Let us understand them one by one.
Price is increasing with increase in volume indicates bullish trend. But is it increase in volume of today, what is the reference point here?
So when you compare the volume you do it with the previous volumes aggregate. For example you can compare the today’s volume in relation to last 10,20,30 or 50 days. Recent sets of data is more relevant in comparison to older.
If there’s a higher volume in a particular stock, that generally means that investors(big) are interested in buying or selling it. If volume and price are on the rise, it means the investors may have stake or betting on that stock.
Whereas if volume is up but price is down, it means more investors are looking to sell. However retail traders thinking this as an opportunity to invest or trade.
Also remember higher volume for a specific security results in higher liquidity as we have discussed above.
Understand volume in reference to above volume trend table :
- If both Volume and Price Increases, it reflects the bullishness, stock may rise in further trading session. Look for buying.
- Whereas, if volume are decreasing but stock price is increasing than, there are more retail participation rather than institutional investors. You need to avoid such situation as it might be a bull trap.
- Whereas if volumes are increasing but price of stock is decreasing than bigger investors are selling, therefore view on stock should be bearish. One should look at selling.
- If both volume and price are decreasing than it means the price is decreasing because of small retail participation, and not because of institutional investors are selling. Because if volume are decreasing it simply means there is no participation from huge investors.
Volume is also decreasing as retailers are selling rather than big investors. This situation can lead to bear trap, one need to avoid placing trade in such scenario.
A counter trade or position can be made, Stick with your trade if you are long (bought), but do not look for buying, you can go short but chances of trend getting reversed is more, so be careful.
You can read more on volume based strategies in stock market here. Now, its the correct time to discuss about moving averages in next section.
How Moving Average Helps In Technical Analysis In Stock Market?
An average is the result that you get when you add two or more numbers together and divide the total by the number of numbers you added together. Confused, oh you know it, you have studied this in math, when you were in school. Add up all the numbers, then divide by how many numbers there are.
Moving averages are best trend indicators, it helps to smooth out the volatility in the price action by removing out the noise from random price fluctuation. A moving average is a trend follow lagging indicator as it is calculated taking past data in to consideration.
Moving average helps in identifying the current trend in a stock. There are 2 most important moving averages in technical analysis, they are
- Simple Moving Average
- Exponential Moving Average
Let us understand them in detail one by one.
How To Use Simple Moving Average (SMA) In Technical Analysis?
Simple moving average uses latest data point and discards the oldest data to calculate average. The Simple Moving Average is possibly the most popular technical analysis tool used by traders and investors.
Generally, the calculation of moving average is always based on the closing prices. Sometimes, moving averages are also calculated using other variable such as high, low, and open.
However the closing prices are used mostly by the traders and investors as it reflects the price at which the the stock or index finally settles for the day.
The Simple Moving Average (SMA) is mostly used to identify trend direction, and to generate potential buy and sell signals.
Let us take an example of a Simple Moving Average:
Date | Closing Price |
04/01/2021 | 110.2 |
05/01/2021 | 110.6 |
06/01/2021 | 112.8 |
07/01/2021 | 114.8 |
08/01/2021 | 118.15 |
Total | 566.55 |
Suppose, above is closing price of a stock named XYZ, 566.55/5= 113.31, this is the average price of stock named XYZ, for last 5 trading sessions.
Now, moving ahead, the next day market opened is on 11/05/2021 (9,10 being Saturday, Sunday). Now to calculate the latest 5 day average we will drop the data of 04/05/2020. Below is how it will look like:
Date | Closing Price |
05/01/2021 | 110.6 |
06/01/2021 | 112.8 |
07/01/2021 | 114.8 |
08/01/2021 | 118.15 |
11/01/2021 | 121 |
Total | 577.35 |
577.35/5=115.47, now this is the latest 5 days average price of the stock XYZ, we have omitted the data of 04 and included the data on 11. Likewise, for 12 we will omit 05 and include 12 so on and so forth.
As, we have read above Moving averages or Simple moving average uses latest data point and discards the oldest data to calculate average.
That is the reason it is called moving average, as the data we are using is the latest, above is an example of 5day SMA, as we are using only latest 5 day data.
You can calculate moving average(MA) for any time frame, from minutes, hours to years. Depending upon your need you just need to select it on the software tool provided to you.
Just for reference you can do the same in MS excel, similar to below you can use (10,25,50,100,200) data to create different SMA.
This is just to make you understand about the moving averages you do not need to do it manually. Whichever trading platform you are using it will be available as its one of the basic indicators in Stock market.
We already know now, Moving Average is a average calculation where the latest data is included, and the oldest is excluded .
SMA specifically tells about the movement of the price is going up or down, by drawing a smooth line next to it. Let us see how it looks on chart below:
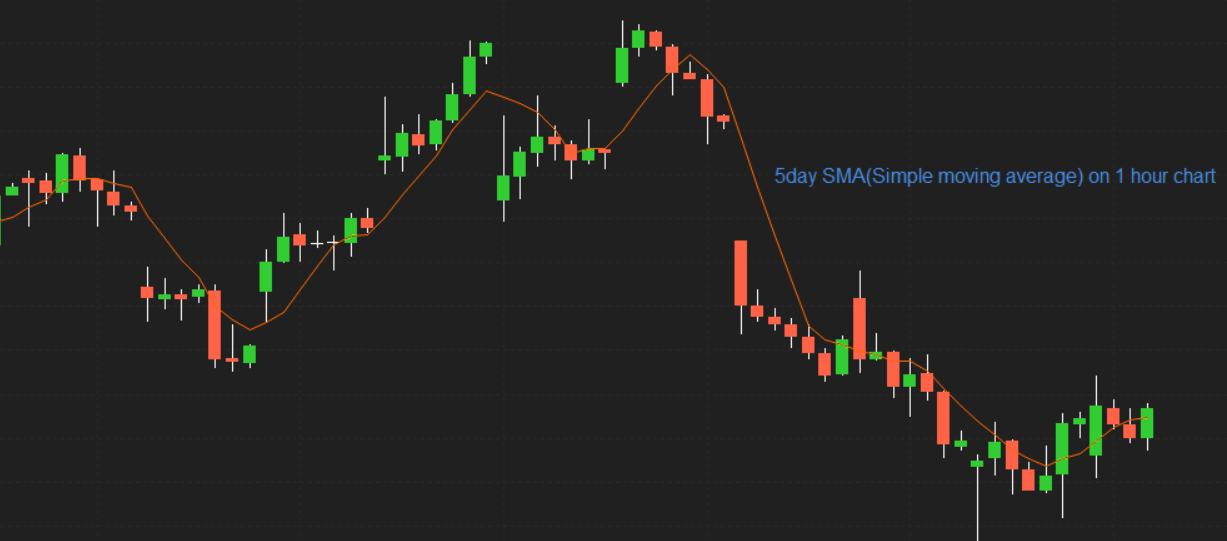
In the chart(1hour) shown above, I have plotted a 5 day SMA over Axis bank candlestick graph. The orange line tells the latest 5 day average of the stock price.
A newbie trader might start buying and selling, looking at the indicator, buying when it is above the average price and selling when it is below the average price.
However, if trading were that easy, everyone would be making money hand over fist. One need to hold his horses, before simply going with SMA.
Look at below 25 SMA chart of nifty.

One might have short at the top and waited, till the indicator shows any reversal signal. You need to understand that SMA is a lagging indicator, it will only tell you what has already happened, that is why you need to use this with in combination with other technical indicators.
Having said that, first you need to know the best combination or standalone choices of various SMA you can make.![]()
What Are Best SMA periods to use in Trading?
The major popular moving averages used by most traders are the 10, 20, 50, 100 and 200 days. I have listed below which is best according to type of trading one do in market.
- 5 -SMA – This is for the hyperactive traders. The shorter the SMA period, the more signals you will receive when trading. The best way to use a 5-SMA is in conjunction with a longer SMA period.
- 10-SMA – popular with short-term traders, best for swing traders and intraday traders.
- 20-SMA – For short-term traders or investors, beyond the 20-SMA, you are looking at primary trends.
- 50-SMA – used by traders or investors to scale mid-term trends.
- 200-SMA –These are for long-term trend followers. As an investor you should look for a cross above or below this average to represent if the stock is in a bullish or bearish trend.
You can read complete guide on Simple Moving Average and Best Strategies Here. Let us move on to next important moving average i.e. Exponential Moving Average.
If you are looking for the best stockbroker I would recommend you to checkout this broker, or you can directly use the below link to open the account free of cost.
How To Use Exponential Moving Average (SMA) In Technical Analysis?
Exponential Moving Average (EMA) is one of the best technical indicator used extensively by traders and investors in stock market.
Reason being, exponential moving average (EMA) gives more weight-age to the recent price data as compared to Simple Moving Average (SMA).
EMA is very much similar to SMA as it helps traders to measure trend direction of any security. EMA helps in predicting the future trend, Essentially its a trend direction indicator.
EMA gives more accurate recent price action compare to SMA. This is because EMA uses the latest data point and the oldest data point gets the least observation.
To understand it better let me give you an example:
Date | Closing Price |
01/01/2021 | 200.2 |
02/01/2021 | 201.7 |
03/01/2021 | 203.8 |
04/01/2021 | 205.6 |
05/01/2021 | 210.2 |
Total | 1021.5 |
In the above data, while calculating the average, we give equal important to every price point. The price on 01 Jan is equally important, as the price on 05 Jan.
However, when we talk about stock market, this may not always be true. As we understood above during knowing the base of technical analysis “markets discount everything” .
Which means the latest price that you see on 05 Jan, discounts all the known and unknown information in market. Therefore, the price on 05, is more important than the price on 03, or for that matter 01 Jan.
Hence, EMA uses weightage to data points based on the ‘newness’ of the data. Therefore the data point on 05 Jan gets the highest weightage, 03 Jan gets the next highest weightage, 02 Jan gets the 3rd highest, so on and so forth.
By doing so, we are giving, the latest data point maximum observation and the oldest data point gets the least observation.
EMA generally uses the previous value of the EMA in its calculation. Therefore EMA includes all the price data within its current value. Another key point is the more data points you use, the more accurate your EMA will be. For more understanding of the EMA formula you can check this article.
Now, that we know EMA uses this very notion that traders should pay more attention to the most recent price action.
Let us take an example to see how does it look on chart. But before doing so, Remember, MA is a trend following system ,as long as there is a trend, the moving averages works fantastically.
Moreover, you have already know from above discussion “The trend is you friend”. Well, the moving averages like SMA or EMA which helps you to identify this friend.
I have plotted 10 EMA and 10 SMA on the chart below, to let you know, what exactly I mean when we I said, EMA uses the latest data point.

Above is ICICI Bank (1hr) chart, orange line indicates the 10 day EMA, and the blue line indicates the 10 day SMA. Pay attention to chart and observe how the ema, is sticking close in comparison to SMA.
The reason why EMA is quicker to react to the current market price is because EMA gives more importance to the most recent data points. This certainly helps the intraday trader to take quicker trading decisions.
When it comes to live trading, professional traders and quantitative analysts tend to favor the exponential moving average in comparison to the simple moving average.
Which Is Best EMA In Intraday Trading?
In order to apply the exponential moving average for trading or investing, one should know the best time frames to select. Some of the popular combinations for a intraday trader would be:
- 9 day EMA with 21 day EMA : Plot this for short term trades (up to few trading session)
- 25 day EMA with 50 day EMA : Plot this to identify medium term trade (up to few weeks)
- 50 day EMA with 100 Day EMA : Use this to identify trades that lasts up to few months
- 100 day EMA with 200 day EMA : Plot this to identify long term trades ,investment opportunities, this can even last for over a year or more. Keep in mind that, longer the time frame the lesser the number of trading signals it creates.
Let us apply few of them to check the trading signal with entry and exit.

Above is ITC Ltd.(1hour) chart, there were couple of signals that were created, mind its a 1 hour chart so every candle that you see is showing the trading activity for last 1 hour. I have applied 20day EMA to above ITC chart.
Once could have bought at the levels when the stock moved above the 20 day EMA, and have either done the partial profit booking or complete, when you are trading intraday do remember to book your profit, as there is no certainty how long the uptrend will prevail.
As, you can see, there is a area where you find the ignore signal, it means if you are in that position either you exit the trade or be in trade, it all depends upon your risk taking ability.
This is where the role of of different indicators like support and resistance comes in to play. If you are aware that level is support area for the stock you can continue holding the position or else you can exit.
Above is the most simple strategy, you can read best intraday trading strategies based on EMA here.
Till, now we have covered from most basics to advanced steps required in learning technical analysis in stock market, now it’s time to introduce the major contributor while doing the technical analysis that is ‘Technical Indicators’.
Although MA itself are part of technical indicators but there are others too which are very important to learn.
There are many technical indicators and it is impossible to cove each of them in great detail in one single post, Hence we will cover the most important one’s only.
Another point is the list of indicators that we will be understanding will be more than enough for you to start trading and investing without looking like a beginner or someone who does not know them at all.
If you are looking for the best stockbroker I would recommend you to checkout this broker, or you can directly use the below link to open the account free of cost.
Best Technical Indicators For Technical Analysis In Stock Market:
A technical indicator is a mathematical formula applied to securities price, volume, open interest which results in a value that is use to predict to futures changes in the prices of that security. They are very useful in gauging the entry, exit while trading and investing.
A technical indicator serves three main function, to alert, confirm and predict. Which can be used to find out price action, breakouts during a rally, or future price movement for any stock. There are mainly 2 types of technical indicators:
- Leading Indicator
- Lagging Indicator
We will try to understand from both types of indicators one by one, but before that let us first know what are they.
What Is Leading Indicator?
Leading indicators are designed to lead price movements, a leading indicators gives early signals to make entry and exits during a trade. As the name suggests they lead in providing signals before the event has occurred, Which means it signals the occurrence of a reversal or a new trend in advance. some of the most common leading indicators are Relative Strength Index (RSI), William’s % R, Stochastic Oscillator, Momentum etc.
A majority of leading indicators are called oscillators as they oscillate within a bounded range. Usually an oscillator oscillates between two extreme values – for example, 0 to 100. Based on the oscillator’s reading (for example 55, 70 etc.) the trading interpretation varies.
What Is Lagging Indicator?
A lagging indicator follow’s an event, it would follow a trend rather than predicting a reversal. A lagging indicator works well when prices moves relatively in longer trends. They won’t warn you of the upcoming changes in prices, instead tells you what exactly prices are doing i.e. whether they are rising or falling.
A lagging indicator may be late to predict the future events but it is quite helpful in keeping you on the right side of the market by reducing your risk.
Now you may think what is the purpose of getting a signal after the event has occurred well, it is better late than never.
Whereas the leading indicator may give you the early signals but keep in mind not all leading indicators are accurate, moreover leading indicators may give you false signals in a volatile market too.
Example of lagging indicator is Moving averages itself that we have discussed above other than this, MACD (Moving average convergence divergence) is also comes under lagging indicators.
Therebefore, you have to keep a balance between both type of indicators and use them in tandem. Both have unique functionality and purpose when you do trading and investing in stock market.
Before we further understand individual indicators, I think it is a good idea to understand what momentum means.
What Is Momentum In Stock Market?
Momentum is the rate at which the price changes. For example if stock price is Rs.50 today and it moves to Rs.55 the next day, and Rs.60, the day after. This means the stock has moved about as the momentum is high as the stock price has changed by 30% in just 3 days.
Moreover, if the same 30% change happened over let us say 2 months, than you can assume the momentum is low. In other words, the more swiftly the price changes, the higher is the momentum.
Now, let us discuss one leading indicator first and than a lagging indicator in detail to understand them and how thy can be very useful for you as an trader and investor.
How To Use Relative Strength Index (RSI) Indicator?
Relative strength index or famously known as RSI Indicator is basically a momentum indicator. Momentum is nothing but the rate at which the price changes.
RSI indicator is also a leading indicator, which means it signals the occurrence of a reversal or a new trend in advance.
When momentum increases and the price is rising, it indicates that the stock is being actively bought in the market. If momentum increases to the downside, it is a sign that the selling pressure is increasing.
RSI indicator in stock markets is often used to identify price tops and bottoms by focusing on key levels (usually 30, 70 and 80,20) on the RSI chart which is scaled from 0-100.
It means RSI oscillates between 0 and 100. RSI indicator shows the internal strength of any stock and also useful in sideways or range based trading sessions. We will not be discussing about the formula and how to calculate it as, It will be available as a technical indicator inside your trading tool given to you by your broker.
You may decide to use 5,10,20, or even 100 days look back period if you want too. Using 14 days is not compulsory. Keeping in mind the farther look back period you take the trading signal will be less, you use longer periods for investing not trading.
How To Read RSI Indicator On Chart?
The RSI is a basic estimation of how good a stock is performing against itself by comparing the strength of the average up days versus the average down days.
This number then quantified with in a range between 0 and 100. RSI indicator is much more than buy or sell signal. It can help you in knowing the trend whether, upwards, downwards or sideways.
A reading above 70 is considered bullish, while a reading below 30 is an indication of bearishness. In other words
- When the RSI indicator is between 0 and 30, the stock is supposed to be oversold, it may remain in that zone further. However probability of that stock going upward is higher as it is already in oversold zone.
- When the stock reading is between 70 and 100, the stock is supposed to be over bought zone and is prepared for a downward correction. Having said that a stock can remain in that zone.
What Are Best RSI settings for Intraday Trading?
Although the default settings for RSI is 14 periods, traders may choose to modify it in order to increase sensitivity (fewer periods) or decrease sensitivity (more periods). Therefore, a 7-day RSI is more sensitive to price movements than one that considers 14 or 21 days.
Moreover, short-term trading setups may adjust the RSI indicator to consider 20 and 80 as oversold and overbought levels (instead of 30 and 70), so it is less likely to provide false signals.

Let us see how the RSI indicator appears on chart:

As you can see in above INDUSIND BANK (day chart), the RSI Indicator was earlier in lower trajectory, than it started moving up, one can look for buying opportunity as it moved from above 30(to be on safer),
However the moment it reached in range of (70-80) which is also the overbought zone, it gradually started falling, one can look for selling option here.
There are Few other Important points you need to keep in mind while trading or investing using RSI Indicator:
- If there is an uptrend or market being bullish(up) ,the RSI indicator tends to remain in the 40 to 90 zone with the 40-50 zone acting as support.
- Whereas if there is a downtrend or market showing bearish sentiment, the RSI indicator will stay in between the 10 to 60 range with the 50-60 zone acting as resistance.
- Also, keep in mind while you place trades in intraday about the candlestick patterns its developing to be at better hand.
- If you are a investor(long term), you need to keep in mind that a stock can be in uptrend, may make new high for few days to few years therefore, RSI will remain stuck in the overbought zone for a long time, this happens because RSI cannot go beyond 100. For ex- Eicher motors, MRF, etc.
- Likewise, a stock in a bearish zone, constantly making new lows can get stuck in the oversold region for long ,the RSI would be going below 30 to 0. It cannot go beyond 0. In this case as well as a investor you might be looking for buying opportunities, however the stock will be going down lower. For example, PC jeweler, vakrange, Gitanjali Gems etc.
- Many investors will apply a horizontal trend-line that is between 30% and 70% levels when a strong trend is in place to better identify extreme movements.
- In case if RSI is stuck in an overbought region for a long period, check for buying opportunities instead of short.
- If RSI is firmed in an oversold region for long time, look for shorting opportunities rather than buy.
- In case if RSI reading starts moving from the oversold zone (Going above 20) after a long period, look for buying opportunities.
- In case if RSI reading starts moving from the overbought region (Falling below 80) after a long time, look for shorting opportunities.

The RSI indicator is much more than a buy and sell signal indicator. Do not think it is only useful for day trading, for an investors perspective RSI has better things to offer too. It is because RSI can provide you the ability to gauge the primary direction of the trend.
You can read RSI Indicator based intraday trading strategies here. Let us discus one major lagging indicator now which is Moving average convergence divergence popularly known as MACD.
If you are looking for the best stockbroker I would recommend you to checkout this broker, or you can directly use the below link to open the account free of cost.
How To Use MACD Indicator For Technical Analysis In Stock Market?
MACD indicator is indisputably very popular momentum(trend) indicator used in technical analysis in stock market. MACD is a acronym used for Moving Average Convergence Divergence.
MACD indicator is a combination of two different exponential moving average.
Out of the two moving averages one is of shorter time period (12day EMA) and the other longer time period (26day EMA). It gets calculated by subtracting 26 day EMA from 12day EMA.
This results in giving a MACD line. After that, a 9day ema also called as signal line is plotted on the top of the MACD line to generate a trigger for buy and sell signal for any stock or index.
One can buy (go long) the security when the MACD (line) crosses above its signal line (9day EMA line) and sell (go short) the security when the MACD crosses below the signal line.
The MACD are useful for measuring market momentum as well as possible price trends and is employed by many traders and investors to identify potential entry and exit points in market.
What Is The Formula For MACD?
MACD Line: 12-day EMA minus 26-day EMA
Signal Line: 9-day EMA of MACD Line
MACD Histogram: MACD Line – Signal Line
“12, 26, 9” as the MACD parameters is usually the default setting for most charting software.
Here the The 12 represents the previous 12 bars of the faster moving average. The 26 represents the previous 26 bars of the slower moving average.
The 9 represents the previous 9 bars of the difference between the two moving averages(12,26). This is plotted by vertical lines called a Histogram.
There is a general misinterpretation when it comes to the lines of the MACD. The two lines that are drawn are not moving averages of the price of the stock or index you are trading. Instead, they are the moving averages of the difference between two moving averages.
The Histogram simply plots the difference between the 12 and 26 day moving average.
Let us look to a chart by plotting MACD indicator below to understand it better:

- The MACD line (1): helps knowing upward or downward momentum (market trend).Remember ‘trend is your friend’ this is where the most money stored. We already know, it gets calculated by subtracting two exponential moving averages (EMA).
- The signal line (2): an EMA of the MACD line ( 9-day EMA). This helps you identifying potential triggers for reversals or entry and exit points.
- Histogram (3): It is just a a graphical representation of the divergence and convergence of the MACD line and the signal line. As mentioned above, histogram is calculated based on the differences between the two lines.(Note that the histogram bars have nothing to do with the trading volume of the stock or index).
If you look at the chart above, you can see that, as the two moving averages goes apart, the histogram gets bigger. This is called a MACD divergence because the faster moving average is “diverging” or moving away from the slower moving average.
As the moving averages get nearer to each other, the histogram gets smaller. This is called convergence because the (12 day) faster moving average is “converging” or getting closer to the (26 day) slower moving average.
What Are Best MACD Indicator setting for Intraday trading?
There is one thing which is constant in stock market, it is called ‘change, the market is always keep on changing, hence there is no such thing as best MACD setting.
You can try to do different experiments, however it is advisable to use the default “12,26,9” setting.
You can also try and use different time intervals, in case you want to do any sort of experiment. For that you can use
(faster moving average)Short-term intervals – 3, 5, 7, 9, 11, 12, 14, 15-day
(slower moving average)For Long-term intervals – 21, 26, 30, 45, 50, 90, 200-day.
Besides this 9-day and 12-day duration are more popular in short term trends.
Where as 26-day, 50-day intervals are more used for long term trends. MACD (5, 35, 5) is also used by many fundamentalist and technical specialist around the world. One can choose the chart time frame(minutes, hourly, daily, weekly or yearly).
let us look at the chart below to segregate, MACD Line, Center line, signal line and histogram.


As, you can see in the chart (day) above (SBI BANK), we have plotted the MACD indicator, below the chart you see the settings I have done to get those plotted.
One important thing that we missed is the central line, which is in between the histogram that you see. When, MACD line move up(bullish) or below(bearish) this central line, it indicates the bullishness or bearishness in the asset.
However there is one problem with the central line:
While waiting for the MACD line to crossover the center line a major move would already be done and perhaps it would be late to enter a trade. To overcome this, there is an improvisation over this basic MACD line, that is what we are using as 9-day ema line.
You can read MACD Indicator based intraday trading Strategies here.
Till now we have covered everything that you will need to from basic to expertise in technical analysis in stock market, however apart from above two indicators we have discussed I would advise you go through Bollinger band Indicator and Fibonacci Retracements levels as well.
I would suggest you to have at least 3 to 4 technical tools and indicators in your arsenal, so that you can make different strategies and can experiment with them. Apart from above technical analysis you should also learn different trading strategies and types of trading that happens in stock market as an beginner.
Let us now clear some myths and doubts by taking some questions related to technical analysis in stock market.
If you are looking for the best stockbroker I would recommend you to checkout this broker, or you can directly use the below link to open the account free of cost.
Frequently Asked Question (FAQ):
1. Is technical analysis real?
Of course, technical analysis is not only real but it also works in real time scenario while trading and investing in stock market. Having said that one need to know it is not some magic wand which will make you rich overnight, technical analysis requires handwork, dedication and lot of observation while implementing it live.
2. Can technical analysis make money?
Yes, technical analysis can surely help you to make money in stock market or at least save you from loosing your hard earned money. A trader or investor who does not have any skills to do technical analysis is sure going to loose much more than one who knows it and applies it. However, one need to understand making money through technical analysis requires patience’s and correct implementation.
3. When technical analysis does not work?
In a highly volatile market technical analysis may not work, the technical indicators, chart patterns or other tools and resources may start giving you false signal as well. Hence one should avoid to place trades based on them in highly volatile situation.
For example : If there is any sudden disaster happens which impacts the economy such as wars, natural calamities, news on political disruption in a country may lead to create tension and volatility in stock market, therefore one has to be well updated with all latest and recent events taking place while doing trades.
4. Does technical analysis work in stock market?
Yes, technical analysis do work in stock market depending upon how you are using it, as it requires one to have enough understanding of most used charts, patterns, indicators, theories, studies put combined. Technical analysis is based on possibility, whether the result will go in your favor or not is not guaranteed at all.
Having said that, it has its own limitation therefore never assume that technical analysis will always work, sometime it may not work for you as required.
In Nithin Kamath own words, the founder of Zerodha and I am quoting it here,
“Am often asked if Technical Analysis actually works. Firstly, there’s nothing that just “works” in trading. But TA works well for retail as it doesn’t let you trade against the trend & defines stoploss every trade – main reasons for retail traders’ losses.”
5. Technical analysis Vs Fundamental analysis which is better?
If you want to know when to trade i.e. entry, exit points or Price at which one should buy and sell stocks use technical analysis. TA, is best used to identify short term trades and do not use TA for identifying long term investment opportunities.
On the other hand, Fundamental analysis is the method of evaluating a asset by analyzing balance sheet, income statement, profit/loss, cash flows, and other financial/non financial data about the company.
So, if you want to know which security to trade or invest use fundamental analysis. Long term investment opportunities are best identified using fundamental analysis.
6. Where to learn technical analysis for free?
You can learn technical analysis for free on moneycontain website, go to technical analysis page here to get all the information related to technical analysis in easy and simple language.
Conclusion:
There are thousand of studies, patterns, technical indicators which one will suits your trading style depends upon your understanding and experience with them in live market. If you aspire to become a technical trader, ensure you equip yourself with good charting software and best trading platforms.
Technical indicator tend to give mixed signals in some cases if used in isolation, therefore make a thumb rule to use it with studies such as candlestick chart patterns, moving averages, volumes, and tools. Because one indicator may show a buy signal whereas the other one may show sell signal.
Technical analysis in stock market is all about possibility, the trade may go to losing side even after efficient analysis as well. Another point is two technical analyst might have different opinion about the same stock as market tends to be extremely dynamic in nature.
If you are starting fresh or not a seasoned trader, I suggest you avoid day trading at start. Start with trades to hold the trade for a few days. This is called ‘Positional Trading’ or ‘Swing Trading’. An active swing trader usually keeps his trading position open for a few days.
If you’re looking to leave your day job and start day trading for a living, then you’ve got a challenging but exciting journey ahead for you.
Before you do so you need to keep in mind that it requires lot of time and energy to build strategies working in your favor. Moreover you need to have effective risk and money management strategies as well.
It may happen that none of these trading strategies and indicators fit for your personality. Do not lose hope there are lots of other strategies to look for, and with just a little research you may be able to find a strategy that is a perfect fit for you.
But implementing them requires discipline and a firm grasp on your emotions. It is also heavily dependent on your psychology. To become successful you will need to prioritize a style according to how your mind works.
If you are a newbie, think of trading and investing please work with small amounts initially and don’t take bigger risks with your hard earned money.
Here is the final list of things you should do as an technical analyst before opening a trade:
1.Make sure to choose enough liquid stocks for trading so that you can buy and sell them in market without much hassle. One way to ensure adequate liquidity is to look at the bid-ask spread.
2.The lesser the spread, the more liquid the stock, volume in a stock is another criteria while choosing a stock to trade. You can choose stocks from Nifty50 index or Sensex 30 as they have enough liquidity.
3.Another thing is observation, use above technical analysis criteria such as checking out the candlestick chart patterns formed by the stock in last few days and weeks, you can also keep an eye on different time frames such as hourly or minute charts while doing intraday trades.
4.Also, make sure to check the support and resistance levels and pivot points of the stock for intraday, this will help you to make correct enter and exit levels.
5.Apply moving averages to the chart to identify the ongoing trend, now its time to select few technical indicators such as RSI, MACD,BB etc. to know the correct levels and flow with the trend.
6.Once few stock has been selected its time to choose the one to place trade, as a newbie do not try to place trades in several stocks at once, keep it one at a time always. Yes, you can keep them in your watchlist to track their movements.
7.Once the trade been placed never ever, I said never ever run away by exiting the trade right away, as it might happen the moment you place the trade the stock will go down or up. Trust me these will definitely going to happen with you, therefore it is always advisable to put the stop-loss or target before placing the trade and let the trade going on.
8.Profit or loss both may happen on that trade, whatever happens you need to learn from that that is why I always insist for a beginner to never place all the money in single trade and avoid using margins or leverage. Trust me this will explode your finance, keep it as low as possible in the start.
9.Just try to get the glimpse of what happens when the trade is placed, your mind, body reaction will tell you different things to do for example the mind will say you made the wrong assumption, the body may feel shivers yes it happens as it’s about your hard earned money.
10.But with time, experience and observations you will definitely going to achieve a firm belief of how these things works in real time. Earning money through trading and investing takes time and energy just like any other filed so do not expect something magical out of it.
I hope you have liked the content on how to do technical analysis in stock market and I wish you all the best for your future endeavors. May god shower you with lot of success and wealth.
If you are looking for the best stockbroker I would recommend you to checkout this broker, or you can directly use the below link to open the account free of cost.
Harshad Mehta Scam Know the Real Story of Amitabh Bachchan of the Stock market.
If you are a beginner in trading and investing, please read this amazing guide on how share market works in India?
Are you looking to invest a lumpsum amount in any fund, than you must know the future value of your investment. Use moneycontain lumpsum sip calculator with inflation here to calculate it easily in 3 steps.
Want to know how much you need to save to reach a specific target than do check moneycontain monthly savings goal calculator here.
Looking to know how much EMI you need to pay for your credit card than do checkout moneycontain Credit Card Calculator Here.
Looking for a fixed monthly income than see Post Office Monthly Income Scheme Calculator, (POMIS Calculator) is created by moneycontain for investors to find out how much to expect as fixed monthly returns when they deposit lumpsum amount in this scheme.
Do you want to know how much return your stocks, mutual funds, lumpsum investments in fixed deposit or RD have created than see moneycontain CAGR calculator here.
If, you have liked the content please do share it with your friends or on social media, as sharing do bring the good karma. If you have any questions or feedback you can leave them in comment box below.
Note: Please do your own research and make investment. Moneycontain will not be responsible for any of your losses at all. The point made is for educational purpose only and intended to give information. All investments are subject to risks, which should be considered prior to making any investments.


