
What Is RSI Indicator?
Relative strength index or famously known as RSI Indicator is basically a momentum indicator. Momentum is nothing but the rate at which the price changes.
For example if stock price is Rs.50 today and it moves to Rs.55 the next day, and Rs.60, the day after. This means the stock has moved about as the momentum is high as the stock price has changed by 30% in just 3 days.
Moreover, if the same 30% change happened over let us say 2 months, than you can assume the momentum is low. In other words, the more swiftly the price changes, the higher is the momentum.
RSI indicator is also a leading indicator, which means it signals the occurrence of a reversal or a new trend in advance. When momentum increases and the price is rising, it indicates that the stock is being actively bought in the market. If momentum increases to the downside, it is a sign that the selling pressure is increasing.
The Relative Strength Index indicator was created by J. Welles Wilder in 1978. Apart from RSI , there are many other technical tools and resources developed by him like, Parabolic SAR, the Average True Range (ATR), and the Average Directional Index (ADX).
RSI indicator in stock markets is often used to identify price tops and bottoms by focusing on key levels (usually 30, 70 and 80,20) on the RSI chart which is scaled from 0-100.
It means RSI oscillates between 0 and 100. RSI indicator shows the internal strength of any stock and also useful in sideways or range based trading sessions.
Now, that you know definition and meaning of the RSI indicator, let us see how this gets calculated and further the implementation in day trading and investing.
How RSI Is Calculated?
Formula used to calculate RSI:
RSI = 100 – [100 / ( 1 + (Average Gain / Average Loss ) ) ]
In above formula, Average Gain means Average of Upward Price Change & Average Loss is Average of Downward Price Change.
Another point, in this formula average losses considered as positive value. The default setting used for the RSI is 14 days period for daily charts. Which is also Known as ‘look-back period. In case you are analyzing hourly chart default period is 14 hours.
Let us Understand this through an Example: Suppose there is a stock which is trading at 79 on day 0, So the basic RSI indicator calculation will happen like this:

From the above data, let us calculate average gain/loss:
Average Gain – 24/14 =1.714 (14 is the default period)
Average Loss – 16/14 = 1.142
as per RSI formula the calculation will be:
RSI = 100 – [100 / ( 1 + (Average Gain / Average Loss ) ) ]
RSI = 100 – [100 / ( 1 +(1.714/1.142) ) ] ,
= 100 – [100 / ( 1 + 1.500) ]
= 100 – 39.99
RSI = 60.01
Of course, above example is just for an illustration purpose there is no point sitting and calculating the RSI. It will be available as a technical indicator inside your trading tool given to you by your broker.
You may decide to use 5,10,20, or even 100 days look back period if you want too. Using 14 days is not compulsory. Keeping in mind the farther look back period you take the trading signal will be less, you use longer periods for investing not trading.
If you are looking for the best stockbroker I would recommend you to checkout this broker, or you can directly use the below link to open the account free of cost.
How To Read RSI Chart?
The RSI is a basic estimation of how good a stock is performing against itself by comparing the strength of the average up days versus the average down days.
This number then quantified with in a range between 0 and 100. RSI indicator is much more than buy or sell signal. It can help you in knowing the trend whether, upwards, downwards or sideways.
A reading above 70 is considered bullish, while a reading below 30 is an indication of bearishness. In other words
- When the RSI indicator is between 0 and 30, the stock is supposed to be oversold, it may remain in that zone further. However probability of that stock going upward is higher as it is already in oversold zone.
- When the stock reading is between 70 and 100, the stock is supposed to be over bought zone and is prepared for a downward correction. Having said that a stock can remain in that zone.
What Is Best RSI settings for Intraday Trading?
Although the default settings for RSI is 14 periods, traders may choose to modify it in order to increase sensitivity (fewer periods) or decrease sensitivity (more periods). Therefore, a 7-day RSI is more sensitive to price movements than one that considers 14 or 21 days.
Moreover, short-term trading setups may adjust the RSI indicator to consider 20 and 80 as oversold and overbought levels (instead of 30 and 70), so it is less likely to provide false signals.

Let us see how the RSI indicator appears on chart:

As you can see in above INDUSIND BANK (day chart), the RSI Indicator was earlier in lower trajectory, than it started moving up, one can look for buying opportunity as it moved from above 30 (to be on safer),
However the moment it reached in range of (70-80) which is also the overbought zone, it gradually started falling, one can look for selling option here.
We will understand more about the strategies and different implementation of the tool to be illustrated shortly. Before that there are Few other Important points you need to keep in mind while trading or investing:
- If there is an uptrend or market being bullish(up) ,the RSI indicator tends to remain in the 40 to 90 zone with the 40-50 zone acting as support.
- Whereas if there is a downtrend or market showing bearish sentiment, the RSI indicator will stay in between the 10 to 60 range with the 50-60 zone acting as resistance.
- Also, keep in mind while you place trades in intraday about the candlestick patterns its developing to be at better hand.
- If you are a investor(long term), you need to keep in mind that a stock can be in uptrend, may make new high for few days to few years therefore, RSI will remain stuck in the overbought zone for a long time, this happens because RSI cannot go beyond 100. For ex- Eicher motors, MRF, etc.
- Likewise, a stock in a bearish zone, constantly making new lows can get stuck in the oversold region for long ,the RSI would be going below 30 to 0. It cannot go beyond 0. In this case as well as a investor you might be looking for buying opportunities, however the stock will be going down lower. For example, PC jeweler, vakrange, Gitanjali Gems etc.
- Many investors will apply a horizontal trend-line that is between 30% and 70% levels when a strong trend is in place to better identify extreme movements.
- In case if RSI is stuck in an overbought region for a long period, check for buying opportunities instead of short.
- If RSI is firmed in an oversold region for long time, look for shorting opportunities rather than buy.
- In case if RSI reading starts moving from the oversold zone (Going above 20) after a long period, look for buying opportunities.
- In case if RSI reading starts moving from the overbought region (Falling below 80) after a long time, look for shorting opportunities.

If you are looking for the best stockbroker I would recommend you to checkout this broker, or you can directly use the below link to open the account free of cost.
What Are RSI Indicator Best Intraday Trading Strategies?
The RSI indicator is much more than a buy and sell signal indicator. Do not think it is only useful for day trading, for an investors perspective RSI has better things to offer too.
It is because RSI can provide you the ability to gauge the primary direction of the trend. How? let us take a look on the charts below:

This a great example for anyone who has invested either in IPO’s or for short term, a successful trader or investor very well known, when to exit and do profit booking.
Above is IRCTC (day) chart. As, you can see the stock was rallying and reached level of around ₹2000, if you have known the RSI levels, you could have booked the profit and entered again when it went down to level of ₹800.
Another point to notice, RSI being a leading indicator have told the investors much before the price started falling. Also when the price were below 20 level, it is clearly indicating about the stock reaching to a oversold area.
Make sure while doing research better draw a horizontal trend-line(as shown above) in 80-20 for short term and 70-30 for long.
Let us take another example for investors and then we will move to understand what kind of strategies are there for intraday traders.
This example is for long term investors, who either want to make an entry or stuck in any stock:

Above is RELIANCE (5year chart), the reason i want to give this example because most of the long term investor get stuck in such catch 22 situation. One has invested the money let say for 2 to 3 years but the stock stayed in range bound or sideways.
In such situation one should always look at the primary trend of the stock, because of the primary trend is upward, than the stock will surely going to outperform. It may take some more time, but when it will, it will be huge.
For example MRF’s shares grew sharply by 2,210 percent between May 11, 2009 to May 9, 2019. The stock growth consolidated to 154.83 per cent in the last five years.
This stock stayed in the upper zone for much longer time. One more thing to notice in above chart, there was rarely few times when the stock was in oversold or overbought condition.
If someone wants to make a fresh position for long term, that person can look at the RSI levels and can make a perfect entry.
Now let us move to see what RSI Indicator has to offer for short term and intraday traders.

Above is ASIANPAINTS(1 hour chart), as you can see in chart RSI Indicator was already reached to overbought zone, moreover it was also showing the stock was losing strength, but the stock was showing range bound movements. Keep on mind it’s a hourly chart, one could have made an short position, as RSI indicated.
When the stock made a steep fall to lower levels RSI informed about the oversold zones, which is great to make fresh new position (long). By every passing hour, the strength was increase so was the price of the stock.
If you are looking for the best stockbroker I would recommend you to checkout this broker, or you can directly use the below link to open the account free of cost.
How RSI with Support & Resistance Zone For Intraday Trading Works?

In the above AXIS BANK(1 hour) I have used support and resistance zones, which is one of the best method as you are using 2 strong tools before making trade, chances of your failure will be much less as compare to using none or 1.
If you are not aware about the support and resistance please read this here. It is a must known if you are a day trader.
It’s been said that patience is a virtue, look at the chart above , I have used SR(support & resistance) levels with RSI Indicator, to identify the trades in intraday.
Starting from left the stock was at the top where the strongest resistance, meanwhile the RSI level shows the stock is in overbought region. One could have made a short position here.
One more thing i have used here, while doing intraday trades you can can draw a horizontal line at 70 and 30 levels instead of 80 &20, reason being as its a hourly chart not day, 80,20 will give less signals.
Now, when the stock started falling it reached to its support zone at the same time the RSI indicator was showing it in oversold region.
When slowly with little strength the price started moving up, yet the previous resistance was great obstruction, so it started falling again. This time it again tested the support levels, now that support became a very strong zone as the prices did not fall further down.
As a intraday trader it’s a great opportunity for you to go long, even the RSI indicator at the time when stock touched the support level second time, it was showing under oversold zone.
From there the stock touched the second resistance again, now the next time the strong reaches here chances of a breakout will be higher as the stock has already tested that zone twice
How RSI Indicator based on divergences Works?
Besides the RSI indicator scores of 30 and 70 which may advise you potentially oversold and overbought market conditions, traders also make use of the RSI to try and predict trend reversals. Such an approach is based on the bullish and bearish divergences.

RSI bearish divergence forms when the price forms a higher high, and at the same time the RSI decreases, and forms a lower high. You will usually see RSI divergence forming at the top of the bullish market, and this is known as a reversal pattern.
As you can see in the chart above of CIPLA, the stock price is at the top, however if you see the RSI levels it is showing its in overbought zone, after few candles, you can see the price of the stock is in the same range, but the RSI is losing the strength, which means the previous candles are not supporting the price move.
This is called bearish divergence, as the price are high but the RSI levels continuously forming lower highs.
On the other hand, the RSI bullish divergence will form when the price forms a lower low, and the RSI forms a higher low. This is an advance warning sign that the trend direction might change from a downtrend to an uptrend.
Basically, a divergence exists when your indicator does not “agree” with price action on the chart. You can say, when your indicator and price action are out of sync it is a sign of divergence either bullish or bearish, so keep an eye when you read the chart.
If you are looking for the best stockbroker I would recommend you to checkout this broker, or you can directly use the below link to open the account free of cost.
Best MACD-RSI Strategy For Intraday Trading:
MACD indicator is indisputably very popular momentum(trend) indicator used in technical analysis in stock market. MACD is a acronym used for Moving Average Convergence Divergence. MACD indicator is a combination of two different exponential moving average.
Out of the two moving averages one is of shorter time period(12 day EMA) and the other longer time period(26 day EMA). It gets calculated by subtracting 26 day EMA from 12 day EMA.
This results in giving a MACD line. After that, a 9 day ema also called as signal line is plotted on the top of the MACD line to generate a trigger for buy and sell signal for any stock or index.
One can buy(go long) the security when the MACD(line) crosses above its signal line(9day EMA line) and sell (go short) the security when the MACD crosses below the signal line. For best MACD indicator based strategies do read this.
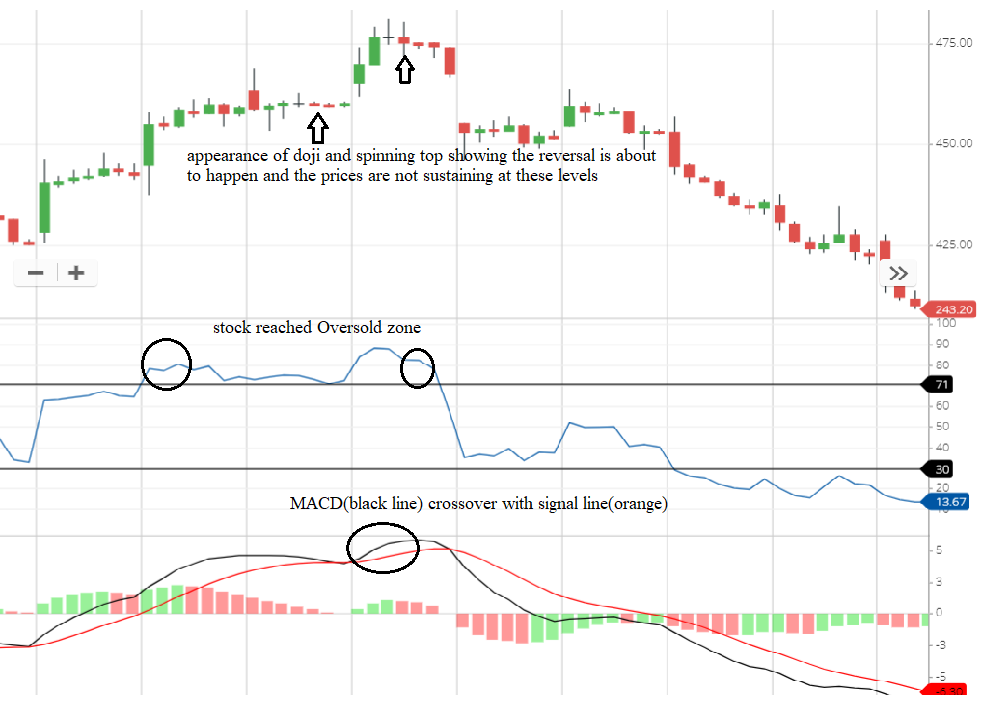
I have combined the MACD indicator with the RSI Indicator in above BANDHAN Bank(1hour) chart, rules are very simple, starting from left, you see the price of the stock is reached to the upper level, RSI levels are confirming that stock is in overbought zone, the price are not sustaining those levels clearly visible through doji and spinning top candles (this candles shows uncertainty, pause in a trend).
At the same time, MACD Line(black) is crossing the signal line(orange) which is a sign of reversal in the trend from bullish to bearish.
As an intraday trader one could have short the position, let me tell you the candles might be looking smaller to you, but the price went down from Rs.480 to Rs.400 within few hours of trading sessions.
Let us see another chart for bullish trend:

The chart is quite self explanatory, I have used MACD, with RSI indicator and have also observed the best candlestick patterns. The chances of failure is much less with such strategy.
Remember, there is no such thing as easy money in the market. It only becomes easy after you have become a master of your art in this case its technical analysis.
If you are looking for the best stockbroker I would recommend you to checkout this broker, or you can directly use the below link to open the account free of cost.
Conclusion:
I might have just told you on few lines about the RSI indicator, such as the settings, the score (30 and 70 or 80/20), look for just overbought and start selling or in oversold zone start accumulating.
However, there are several important factors to consider when using the Relative Strength Index aka RSI indicator. That is why i have tried covering most of the best strategies which is practically possible.
However, one should always keep in mind that no technical indicator is 100% efficient especially if it is used alone. Therefore, traders should consider using the RSI indicator along with other indicators in order to avoid false signals. Just like we learned above.
Since the RSI indicator displays momentum, it can stay overbought or oversold for a long time when an asset has significant momentum in either direction.
Therefore, the RSI is most useful in an oscillating market where stock price is moving between bullish and bearish zones.
Always remember in technical analysis three thing is very important.
Trend is your friend
History repeats itself
Price Action discounts everything
If you are looking for the best stockbroker I would recommend you to checkout this broker, or you can directly use the below link to open the account free of cost.
If you are looking for making an FD fixed deposit than do check best banks in India with Highest FD returns and calculate the value of your FD Moneycontain free FD calculator with inflation.
If you are a beginner I would also advise you to read this ultimate guide for clearing your basics about stock market.
In case you want to know how much you need to save every month to reach your financial goals check out Moneycontain Monthly SIP Calculator with inflation here.
Do you know the concept of present value of your future money, if not then you should.
Just like 100 rupees in your pocket today will not have value of 100 rupees after 5 years, similarly 100 rupees you receive in future, invested today won’t have the same value? Confused ??…
Check moneycontain present value calculator and ultimate guide on NPV here.![]()
If you have to analyze, what would be the value of money that you have today sometime in the future, then you need to move the ‘money today’ through the future i.e. future value of that money.
This is a much read from my end to better understand the flow of money.
If, you have liked the content please do share it with your friends or on social media, as sharing do bring the good karma. Please leave comments if you have any questions or feedback below.
Note: Please do not take this as any recommendation, to trade or invest. This is just for reference, to make you understand more about the RSI Indicator and its importance, under no circumstances intended to be used or considered as financial or investment advice, a recommendation or an offer to sell, or a solicitation of any offer to buy any securities or other form of financial asset.
Please do your own research and make investment. Moneycontain will not be responsible for any of your losses at all. The point made is for educational purpose only. All investments are subject to risks, which should be considered prior to making any investments


