
In this post you will not only going to learn about the best moving average for intraday trading, but the whole guide for moving averages.
This will going to be a one long informative post which will guide you about various moving averages like Simple moving average(SMA), Exponential moving average(EMA), Crossovers strategies like golden cross, death cross, double cross etc.
Moving averages are best trend indicators, we will about them in detail below.
So, whether you are a intraday (day) trader, swing trader, positional trader, short-term trader, long term investor or even do scalping, you will be learning few new things with examples and implementations.
Precisely, this is an ultimate guide for beginners as well as experienced traders or investors to understand the basics of moving average(MA)technical analysis in much simpler language.
I have tried not to use the technical or financial jargon’s mostly used to explain such things. This a step by step guide, you can jump around to your favorite part, however it is advisable to read from beginning till end for better understanding.
What is Average and how to calculate it?
An average is the result that you get when you add two or more numbers together and divide the total by the number of numbers you added together.
Confused, oh you know it, you have studied this in math, when you were in school. Let’s do a little exercise to get our memory back.
You are feeling bored at home, so you went to your friend’s home, you find that he is sleeping, you sat beside him, he knows that you came, but he does not want his sleep to get disturbed so he did not speak. You thought of checking if there is anything kept in his fridge, Surprisingly you find a carat of beverage.
You took one and started drinking, within a span of 5 minutes you finished that, now you have little more urge to have another one. Meanwhile 3 of your mutual friends also came, after knowing about the beverages they also started taking them from fridge.
After an hour when everything is finished, your friend woke up realizing that all his beverages been finished, he started counting. In that caret there were total of 12 bottles, excluding him he has 4 friends at home. How many of beverage was drunk on average by everyone?
| Sl No | Person | No of Bottles |
|---|---|---|
| 01 | A | 02 |
| 02 | B | 03 |
| 03 | C | 03 |
| 04 | D | 04 |
| Total No. of bottles consumed | 12 | |
| Divide (the total number of bottles) by (total number of friends). | ||
In this case it would be:
12/4=3
Although, the average is 3, but the beverage consumed by his friends were different to each of them. Where A consumed only 2, d consumed 4. At, this point one critical thing you need to understand that, average is just an estimate don’t expect it to be accurate.
What Is Formula to calculate Average?
add up all the numbers, then divide by how many numbers there are.
Moving away from this, let us concentrate on stock market, suppose there is a stock named ABC, Below is the closing price of ABC, for last 5 days.
Date | Closing Price |
04/05/2020 | 200.75 |
05/05/2020 | 201.8 |
06/05/2020 | 202.1 |
07/05/2020 | 203.3 |
08/05/2020 | 204 |
Total | 1011.95 |
Now, to calculate the average closing price of last 5 trading sessions of ABC Stock, 1011.95/5 = 202.39
If you are looking for the best stockbroker I would recommend you to checkout this broker, or you can directly use the below link to open the account free of cost.
So, this is how the average gets calculated, let us now understand about the moving average(MA).
What is Moving Average or Simple Moving Average?
Moving averages also called as Simple moving average uses latest data point and discards the oldest data to calculate average.
The Simple Moving Average is possibly the most popular technical analysis tool used by traders and investors.
Generally, the calculation of moving average is always based on the closing prices. Sometimes, moving averages are also calculated using other variable such as high, low, and open.
However the closing prices are used mostly by the traders and investors as it reflects the price at which the the stock or index finally settles for the day.
The Simple Moving Average (SMA) is mostly used to identify trend direction, and to generate potential buy and sell signals. Let us take an example of a Simple Moving Average:
Date | Closing Price |
04/05/2020 | 110.2 |
05/05/2020 | 110.6 |
06/05/2020 | 112.8 |
07/05/2020 | 114.8 |
08/05/2020 | 118.15 |
Total | 566.55 |
Suppose, above is closing price of a stock named XYZ, 566.55/5= 113.31, this is the average price of stock named XYZ, for last 5 trading sessions.
Now, moving ahead, the next day market opened is on 11/05/2020(9,10 being Saturday, Sunday). Now to calculate the latest 5 day average we will drop the data of 04/05/2020. Below is how it will look like:
Date | Closing Price |
05/05/2020 | 110.6 |
06/05/2020 | 112.8 |
07/05/2020 | 114.8 |
08/05/2020 | 118.15 |
11/05/2020 | 121 |
Total | 577.35 |
577.35/5=115.47, now this is the latest 5 days average price of the stock XYZ, we have omitted the data of 04 and included the data on 11. Likewise, for 12 we will omit 05 and include 12 so on and so forth.
As, we have read above Moving averages or Simple moving average uses latest data point and discards the oldest data to calculate average.
That is the reason it is called moving average, as the data we are using is the latest, above is an example of 5day SMA, as we are using only latest 5 day data.
You can calculate moving average(MA) for any time frame, from minutes, hours to years. Depending upon your need you just need to select it on the software tool provided to you.
Just for reference you can do the same in MS excel, similar to below you can use (10,25,50,100,200) data to create different SMA.
This is just to make you understand about the moving averages you do not need to do it manually. Whichever trading platform you are using it will be available as its one of the basic indicators in Stock market.

What Is Formula For Simple Moving Average (SMA)?
SMA = A1+A2+…+An / n
where An= the price of an asset at period n
n= the number of total periods
We already know now, Moving Average is a average calculation where the latest data is included, and the oldest is excluded .
SMA specifically tells about the movement of the price is going up or down, by drawing a smooth line next to it. Let us see how it looks on chart below:
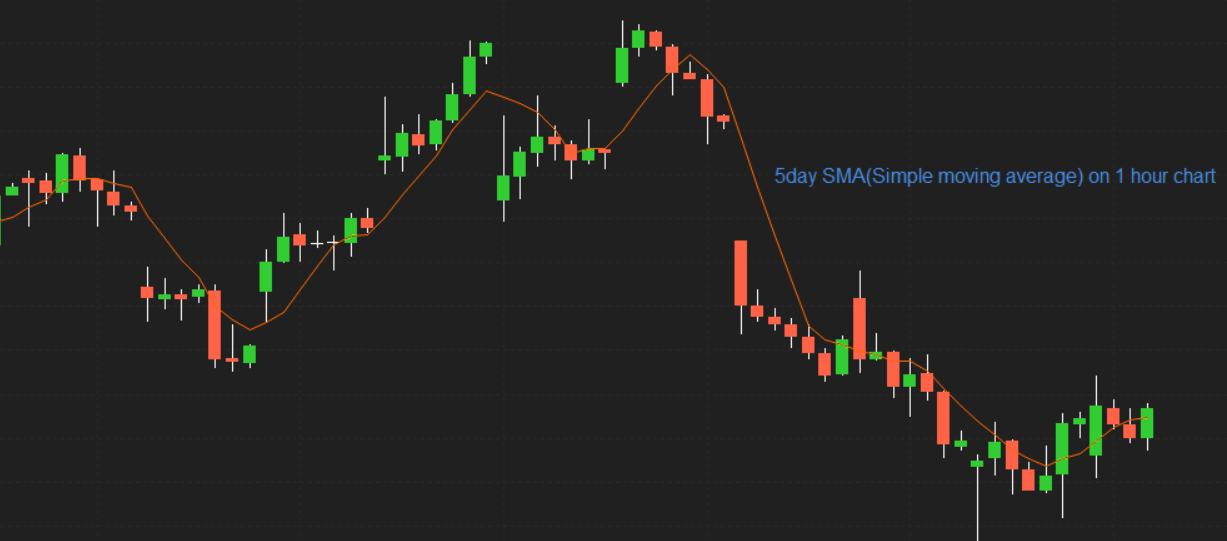
In the chart(1hour) shown above, I have plotted a 5 day SMA over Axis bank candlestick graph. The orange line tells the latest 5 day average of the stock price.
A newbie trader might start buying and selling, looking at the indicator, buying when it is above the average price and selling when it is below the average price.
However, if trading were that easy, everyone would be making money hand over fist. One need to hold his horses, before simply going with SMA.
Look at below 25 SMA chart of nifty.

One might have short at the top and waited, till the indicator shows any reversal signal. You need to understand that SMA is a lagging indicator, it will only tell you what has already happened, that is why you need to use this with in combination with other technical indicators.
If you are looking for the best stockbroker I would recommend you to checkout this broker, or you can directly use the below link to open the account free of cost.
Having said that, first you need to know the best combination or standalone choices of various SMA you can make.![]()
What Are Best SMA periods to use?
The major popular moving averages used by most traders are the 10, 20, 50, 100 and 200 days. I have listed below which is best according to type of trading one do in market.
- 5 -SMA – This is for the hyperactive traders. The shorter the SMA period, the more signals you will receive when trading. The best way to use a 5-SMA is in conjunction with a longer SMA period.
- 10-SMA – popular with short-term traders, best for swing traders and intraday traders.
- 20-SMA – For short-term traders or investors, beyond the 20-SMA, you are looking at primary trends.
- 50-SMA – used by traders or investors to scale mid-term trends.
- 200-SMA –These are for long-term trend followers. As an investor you should look for a cross above or below this average to represent if the stock is in a bullish or bearish trend.
Point to keep in mind while using SMA:
- When the stock price trades above its average price, it simply means that traders are inclined to buy the stock at a price higher than its average price. Which means the traders are hopeful about the stock price going higher. Therefore one should look at buying opportunities.
- Likewise, when the stock price trades below its average price, it means that traders are looking to sell the stock at a price lesser than its average price. Which means the traders are negative about the stock price movement. Therefore one should look at selling opportunities.
- All in all, if a market or security is above key moving averages, it’s perceived to indicate a healthy bullish trend. Conversely, when key moving averages are violated, it’s interpreted as a sign the trend is likely turning bearish.
- As said its an trend indicator, the simplest use of a SMA in analysis is using it to quickly identify if a security is in an uptrend or downtrend.
- Although if market are sideways the plain vanilla Moving Average(SMA) will not be sufficient. As it may give too many signals.
To counter this you can use SMA Crossover Strategy. Also known as Double cross-over method. Double crossovers involve one relatively short moving average (less day) and one relatively long moving average.
It will help you to take less trades in sideways market. It’s an improvisation of Simple Moving Average. Let us learn a little about it.
If you are looking for the best stockbroker I would recommend you to checkout this broker, or you can directly use the below link to open the account free of cost.
Which Is Best Moving Average Crossover strategy (SMA)?
Moving averages by themselves will give you a great game plan for trading the markets. With moving average crossovers will help you to find trigger for entering and closing the trades.
One of the most popular simple moving averages to use with a crossover strategy are the 50 and 200 day. When the 50-simple moving average crosses above the 200 SMA, it generates a golden cross.
On the other hand, when the 50-simple moving average crosses beneath the 200-simple moving average, it creates a death cross.
Points to Remember:
- A Bullish crossover occurs when the shorter moving average (50 days) crosses above the longer moving average (200 days) .
- A Bearish crossover occurs when the longer moving average (200 days) crosses above the shorter moving average (50 days) .
Check the Nifty (day) chart below to understand it better:

As, you cans see in the chart above when the 50 day moving average(orange in color) crosses above, its time to go for buying. This crossover is also known as golden cross.

In above nifty(day), chart the 50 day SMA is crossing below the 200 SMA, time to sell. This is what we call as a death cross.
A buy or sell signal is triggered once the smaller moving average crosses above or below, the larger moving average. However, these are applicable for long-term investing. Since, we are focusing on day trading, a much better combination would be 10 day SMA to 20 day SMA.
Which Is Best Moving Average (Crossovers) for Intraday Trading?
A trader can use various combination to create a Moving Average crossover strategy. But the best for intraday trading would be to use lesser day SMA which is closer to the price movements.
Let us see another chart this time of SBI BANK, (1 hour) chart with 10 day SMA and 20 day SMA.

As, you can see above one should have bought when the 10 day(orange) SMA cross-over the 20 day SMA(green). Likewise for selling, a sell signal got created when the 10 day SMA cross below 20 day SMA.
Now that you know enough about the Simple moving average and various strategies it’s time to introduce the Exponential moving average (EMA) and how this can help you in daily trading or investments.
What is Exponential Moving Average?
Exponential Moving Average (EMA) is one of the best technical indicator used extensively by traders and investors in stock market.
Reason being, exponential moving average (EMA) gives more weight-age to the recent price data as compared to Simple Moving Average (SMA).
EMA is very much similar to SMA as it helps traders to measure trend direction of any security. EMA helps in predicting the future trend, Essentially its a trend direction indicator.
EMA gives more accurate recent price action compare to SMA. This is because EMA uses the latest data point and the oldest data point gets the least observation. To understand it better let me give you an example:
Date | Closing Price |
01/06/2020 | 200.2 |
02/06/2020 | 201.7 |
03/06/2020 | 203.8 |
04/06/2020 | 205.6 |
05/06/2020 | 210.2 |
Total | 1021.5 |
In the above data, while calculating the average, we give equal important to every price point. The price on 01 June is equally important, as the price on 05 June.
However, when we talk about stock market, this may not always be true. In technical analysis, there is a famous quote and I am quoting “markets discount everything” unquote.
Which means the latest price that you see on 05 June, discounts all the known and unknown information in market. Therefore, the price on 05, is more important than the price on 03, or for that matter 01 June.
Hence, EMA uses weightage to data points based on the ‘newness’ of the data. Therefore the data point on 05 June gets the highest weightage, 03 June gets the next highest weightage, 02 June gets the 3rd highest, so on and so forth.
By doing so, we are giving, the latest data point maximum observation and the oldest data point gets the least observation.
If you are looking for the best stockbroker I would recommend you to checkout this broker, or you can directly use the below link to open the account free of cost.
How to calculate Exponential Moving Average (EMA)?
You do not need to calculate EMA by yourself as most of the technical analysis software lets us drag and drop the EMA . This is just good to know info.
- First calculate the SMA
SMA = A1+A2+…+An / n
Where An= the price of an asset at period n
n= the number of total periods
- Than calculate the multiplier for weighting the EMA
Weighted multiplier =2÷(selected time period+1)
selected time period can be 10 day , 20 days , or 100 days depend upon your strategy .
- At end calculate the current EMA
EMA [today] = (Price [today] x K) + (EMA [yesterday] x (1 – K))
Where:
K = 2 ÷(N + 1)
N = the length of the EMA ( time period)
Price [today] = the current closing price
EMA [yesterday] = the previous EMA value
EMA [today] = the current EMA value
EMA generally uses the previous value of the EMA in its calculation. Therefore EMA includes all the price data within its current value.
Another key point is the more data points you use, the more accurate your EMA will be. For more understanding of the EMA formula you can check this article.
Some Best Example of Exponential Moving Average:
Now, that we know EMA uses this very notion that traders should pay more attention to the most recent price action.
Let us take an example to see how does it look on chart. But before doing so, Remember, MA is a trend following system ,as long as there is a trend, the moving averages works fantastically.
Moreover, you may have heard this popular quote in the markets “The trend is you friend”. Well, the moving averages like SMA or EMA which helps you to identify this friend.
I have plotted 10 EMA and 10 SMA on the chart below, to let you know, what exactly i mean when we i said, EMA uses the latest data point.

Above is ICICI Bank (1hr) chart, orange line indicates the 10 day EMA, and the blue line indicates the 10 day SMA. Pay attention to chart and observe how the ema, is sticking close in comparison to sma.
The reason why EMA is quicker to react to the current market price is because EMA gives more importance to the most recent data points. This certainly helps the intraday trader to take quicker trading decisions.
When it comes to live trading, professional traders and quantitative analysts tend to favor the exponential moving average in comparison to the simple moving average.
How To Apply EMA In Intraday Trading?
In order to apply the exponential moving average for trading or investing, one should know the best time frames to select. Some of the popular combinations for a intraday trader would be:
- 9 day EMA with 21 day EMA : Plot this for short term trades (up to few trading session)
- 25 day EMA with 50 day EMA : Plot this to identify medium term trade (up to few weeks)
- 50 day EMA with 100 Day EMA : Use this to identify trades that lasts up to few months
- 100 day EMA with 200 day EMA : Plot this to identify long term trades ,investment opportunities, this can even last for over a year or more. Keep in mind that, longer the time frame the lesser the number of trading signals it creates.
Let us apply few of them to check the trading signal with entry and exit.

Above is ITC Ltd.(1hour) chart, there were couple of signals that were created, mind its a 1 hour chart so every candle that you see is showing the trading activity for last 1 hour. I have applied 20day EMA to above ITC chart.
Once could have bought at the levels when the stock moved above the 20 day EMA, and have either done the partial profit booking or complete, when you are trading intraday do remember to book your profit, as there is no certainty how long the uptrend will prevail.
As, you can see, there is a area where you find the ignore signal, it means if you are in that position either you exit the trade or be in trade, it all depends upon your risk taking ability.
This is where the role of of different indicators like support and resistance comes in to play. If you are aware that level is support area for the stock you can continue holding the position or else you can exit.
Above is the most simple strategy, for better result next we will see the crossover and how it creates buy or sell signal with better accuracy.
If you are looking for the best stockbroker I would recommend you to checkout this broker, or you can directly use the below link to open the account free of cost.
What Are Best Moving Average Crossover strategy (EMA)?
Similar to SMA cross over you can use the EMA, exponential moving average to create crossover strategies. In a MA crossover system, instead of the usual single moving average, the trader combines two moving averages. This is also known as ‘smoothing’.
A classic example of this would be to combine a 50 day EMA, with a 100 day EMA. The shorter moving average (50 days in this case) is also referred to as the faster moving average. The longer moving average (100 days moving average) is referred to as the slower moving average.
The shorter moving average takes lesser number of data points to calculate the average and hence it tends to stick closer to the current market price, and therefore reacts more quickly.
Whereas, the longer moving average takes more number of data points to calculate the average and hence it tends to stay away from the current market price. Hence the reactions are slower.
Let us combine few EMA and see the results:

Above is CIPLA (1day) chart, when the 25day ema(pink line), crosses below the 50day ema(black), it creates a selling opportunity for traders. However, when the 25 day ema goes above the 50 day ema it create best buying opportunity for traders.
Points to Remember:
- A Bullish crossover occurs when the shorter moving average (25 days) crosses above the longer moving average (50 days) .
- A Bearish crossover occurs when the longer moving average (50 days) crosses above the shorter moving average (25 days) .
Similarly you can use other combination such as 10 with 20, 50 with 100 or 100 with 200 etc. Remember the losses are minimum in a moving average system, but that 1 big trade is good enough to compensate all the losses and can give you sufficient profits.
Important points to remember While Using EMA:
- A falling EMA indicates that prices, on average, are falling. Hence this moving can be used to determine buying and selling opportunities in market .
- A rising moving average shows that prices are generally increasing. In other words one should look at buying opportunities.
- A long-term MA(100, 200) moving from a lower position to a higher one reflects a long-term uptrend.
- A long -term plunging MA(100,200) , moving from a higher to a lower level reflects a long-term downtrend.
- EMA is also more vulnerable & get exposed as EMA reacts faster when the price is changing direction. To put it another way it may give you false or fake signals.
- A trader might use crossovers of the 50 EMA by the 10 or 20 EMA as trading signals.
- The most generally used EMAs by traders are the 5, 10, 12, 20, 26, 50, 100, and 200.
- Where as the 50, 100 and 200 EMAs are considered to be useful for longer-term trend trading and investing .
What Is The Difference Between SMA and EMA?
The major difference between an exponential moving average (EMA) and a simple moving average is the sensitivity each one shows to changes in the data used in its calculation.
More precisely the EMA gives a higher weighting to recent prices, while the SMA assigns equal weighting to all values.
The two averages are similar because they are interpreted in the same manner and are both commonly used by technical traders to smooth out price fluctuations.
Since EMA place a higher weighting on recent data than on older data, they are more reactive to the latest price changes than SMA.
That is what makes the results from EMAs more timely and explains why the EMA is the preferred average among many traders and investors.
If you are looking for the best stockbroker I would recommend you to checkout this broker, or you can directly use the below link to open the account free of cost.
Conclusion:
We have learned together so many things and I hope, all of them were easy enough to get you start your journey in technical analysis.
Best Moving Average For Intraday Trading includes SMA, EMA and crossover strategies.
Theses strategies should be used in combination with other technical tools and indicators for better results. Like one should know best candlestick patterns to use in intraday trading as well as how to find the support and resistance levels.
Once you start using it you will eventually know through experience, if a signal is false or does it really a buy or sell. Always keep stop loss while you enter in trade and never forget losing or winning is part of trading and investing, the importance is how long you survive.
Because the longer you will stay in market the more new things you will learn.
If you are looking for the best stockbroker I would recommend you to checkout this broker, or you can directly use the below link to open the account free of cost.
Do you know the concept of present value of your future money, if not then you should.
Just like 100 rupees in your pocket today will not have value of 100 rupees after 5 years, similarly 100 rupees you receive in future, invested today won’t have the same value. ?Confused??
Check moneycontain present value calculator and ultimate guide on NPV here.![]()
If you have to analyze, what would be the value of money that you have today sometime in the future, then you need to move the ‘money today’ through the future i.e. future value of that money.
This is a much read from my end to better understand the flow of money.
If you are looking for making an FD fixed deposit than do check best banks in India with Highest FD returns and calculate the value of your FD Moneycontain free FD calculator with inflation.
If, you have liked the content please do share it with your friends or on social media, as sharing do bring the good karma. Please leave comments if you have any questions or feedback below.
Note: Please do not take this as any recommendation, to trade or invest. This is just for reference, to make you understand more about the MA moving averages and its importance, under no circumstances intended to be used or considered as financial or investment advice, a recommendation or an offer to sell, or a solicitation of any offer to buy any securities or other form of financial asset.
Please do your own research and make investment. Moneycontain will not be responsible for any of your losses at all. The point made is for educational purpose only. All investments are subject to risks, which should be considered prior to making any investments.


